The financial statistics tool allows you to track and analyze your project expenses within the system.

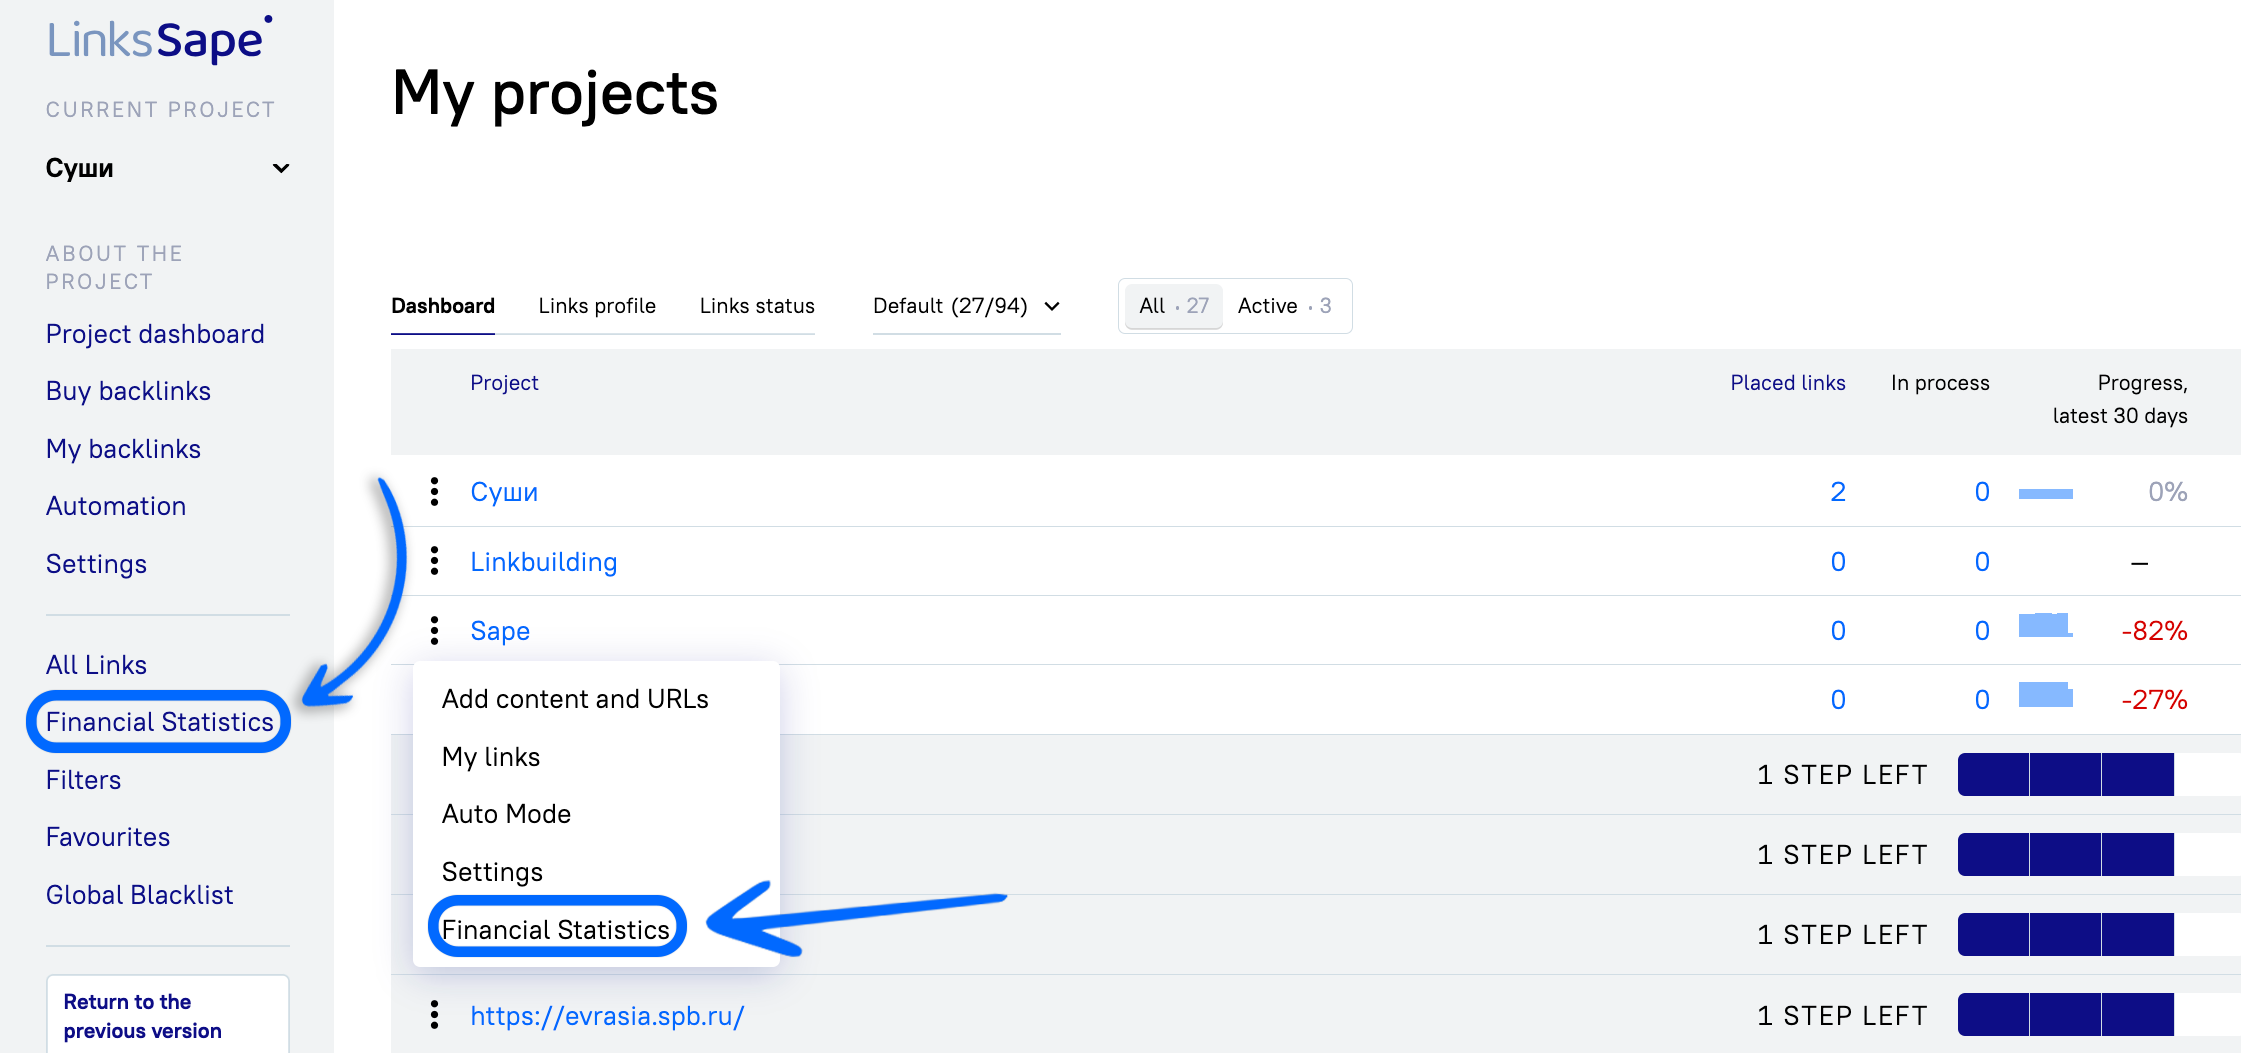
In the left menu, go to the "Financial Statistics" section. You can also access this section by selecting the corresponding option in the project menu (All Projects -> three dots next to the project name -> Financial Statistics).

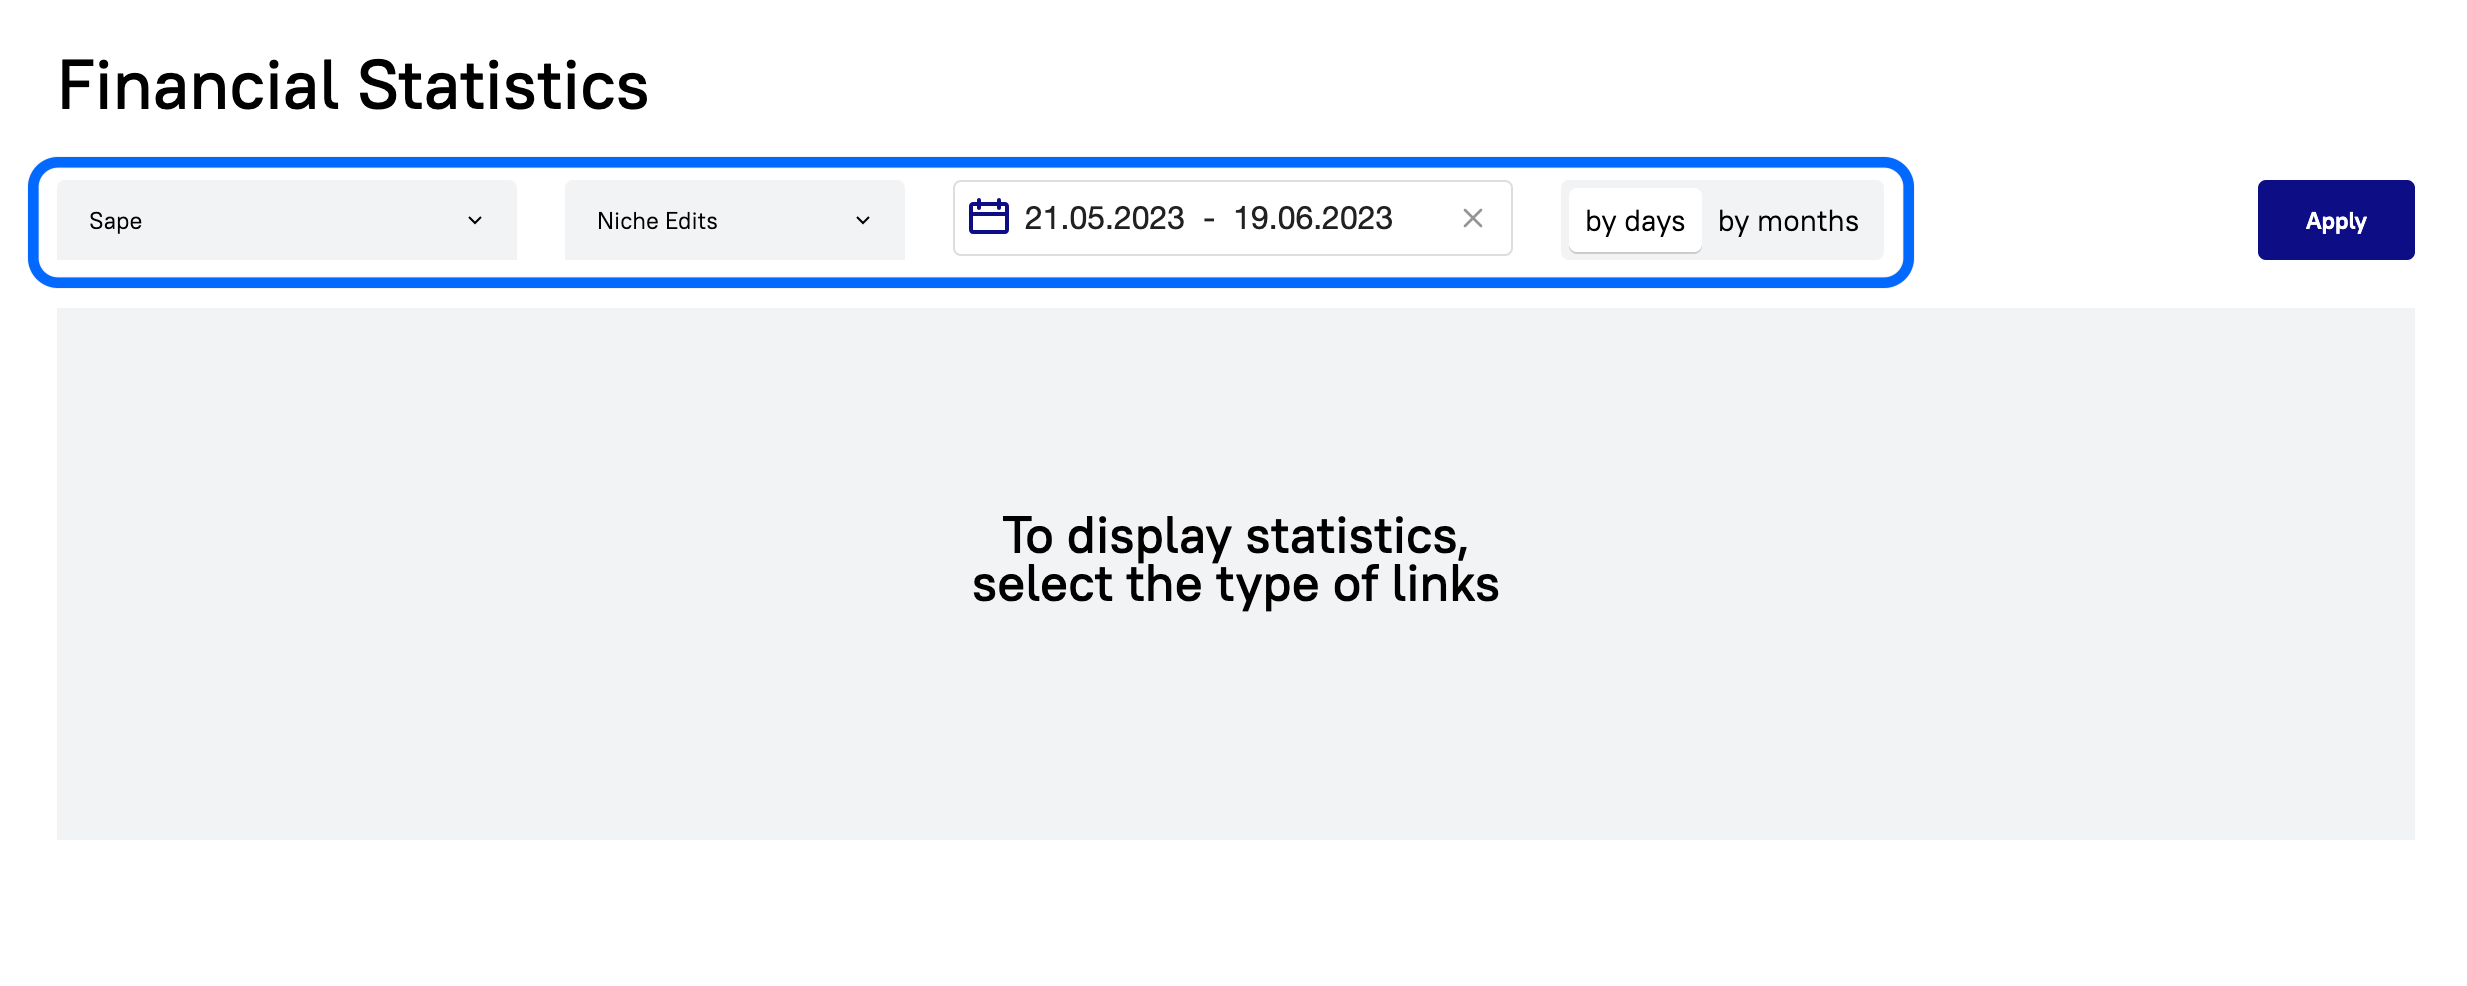
Choose the desired parameters:
Project - either a specific project or all projects at once.
Link Type - rental or article links.
Dates - the time period for which the expenses for purchasing the selected type of links will be displayed.
You can choose the display mode: daily or monthly. Clicking the "Apply" button will display the statistics according to the selected parameters.
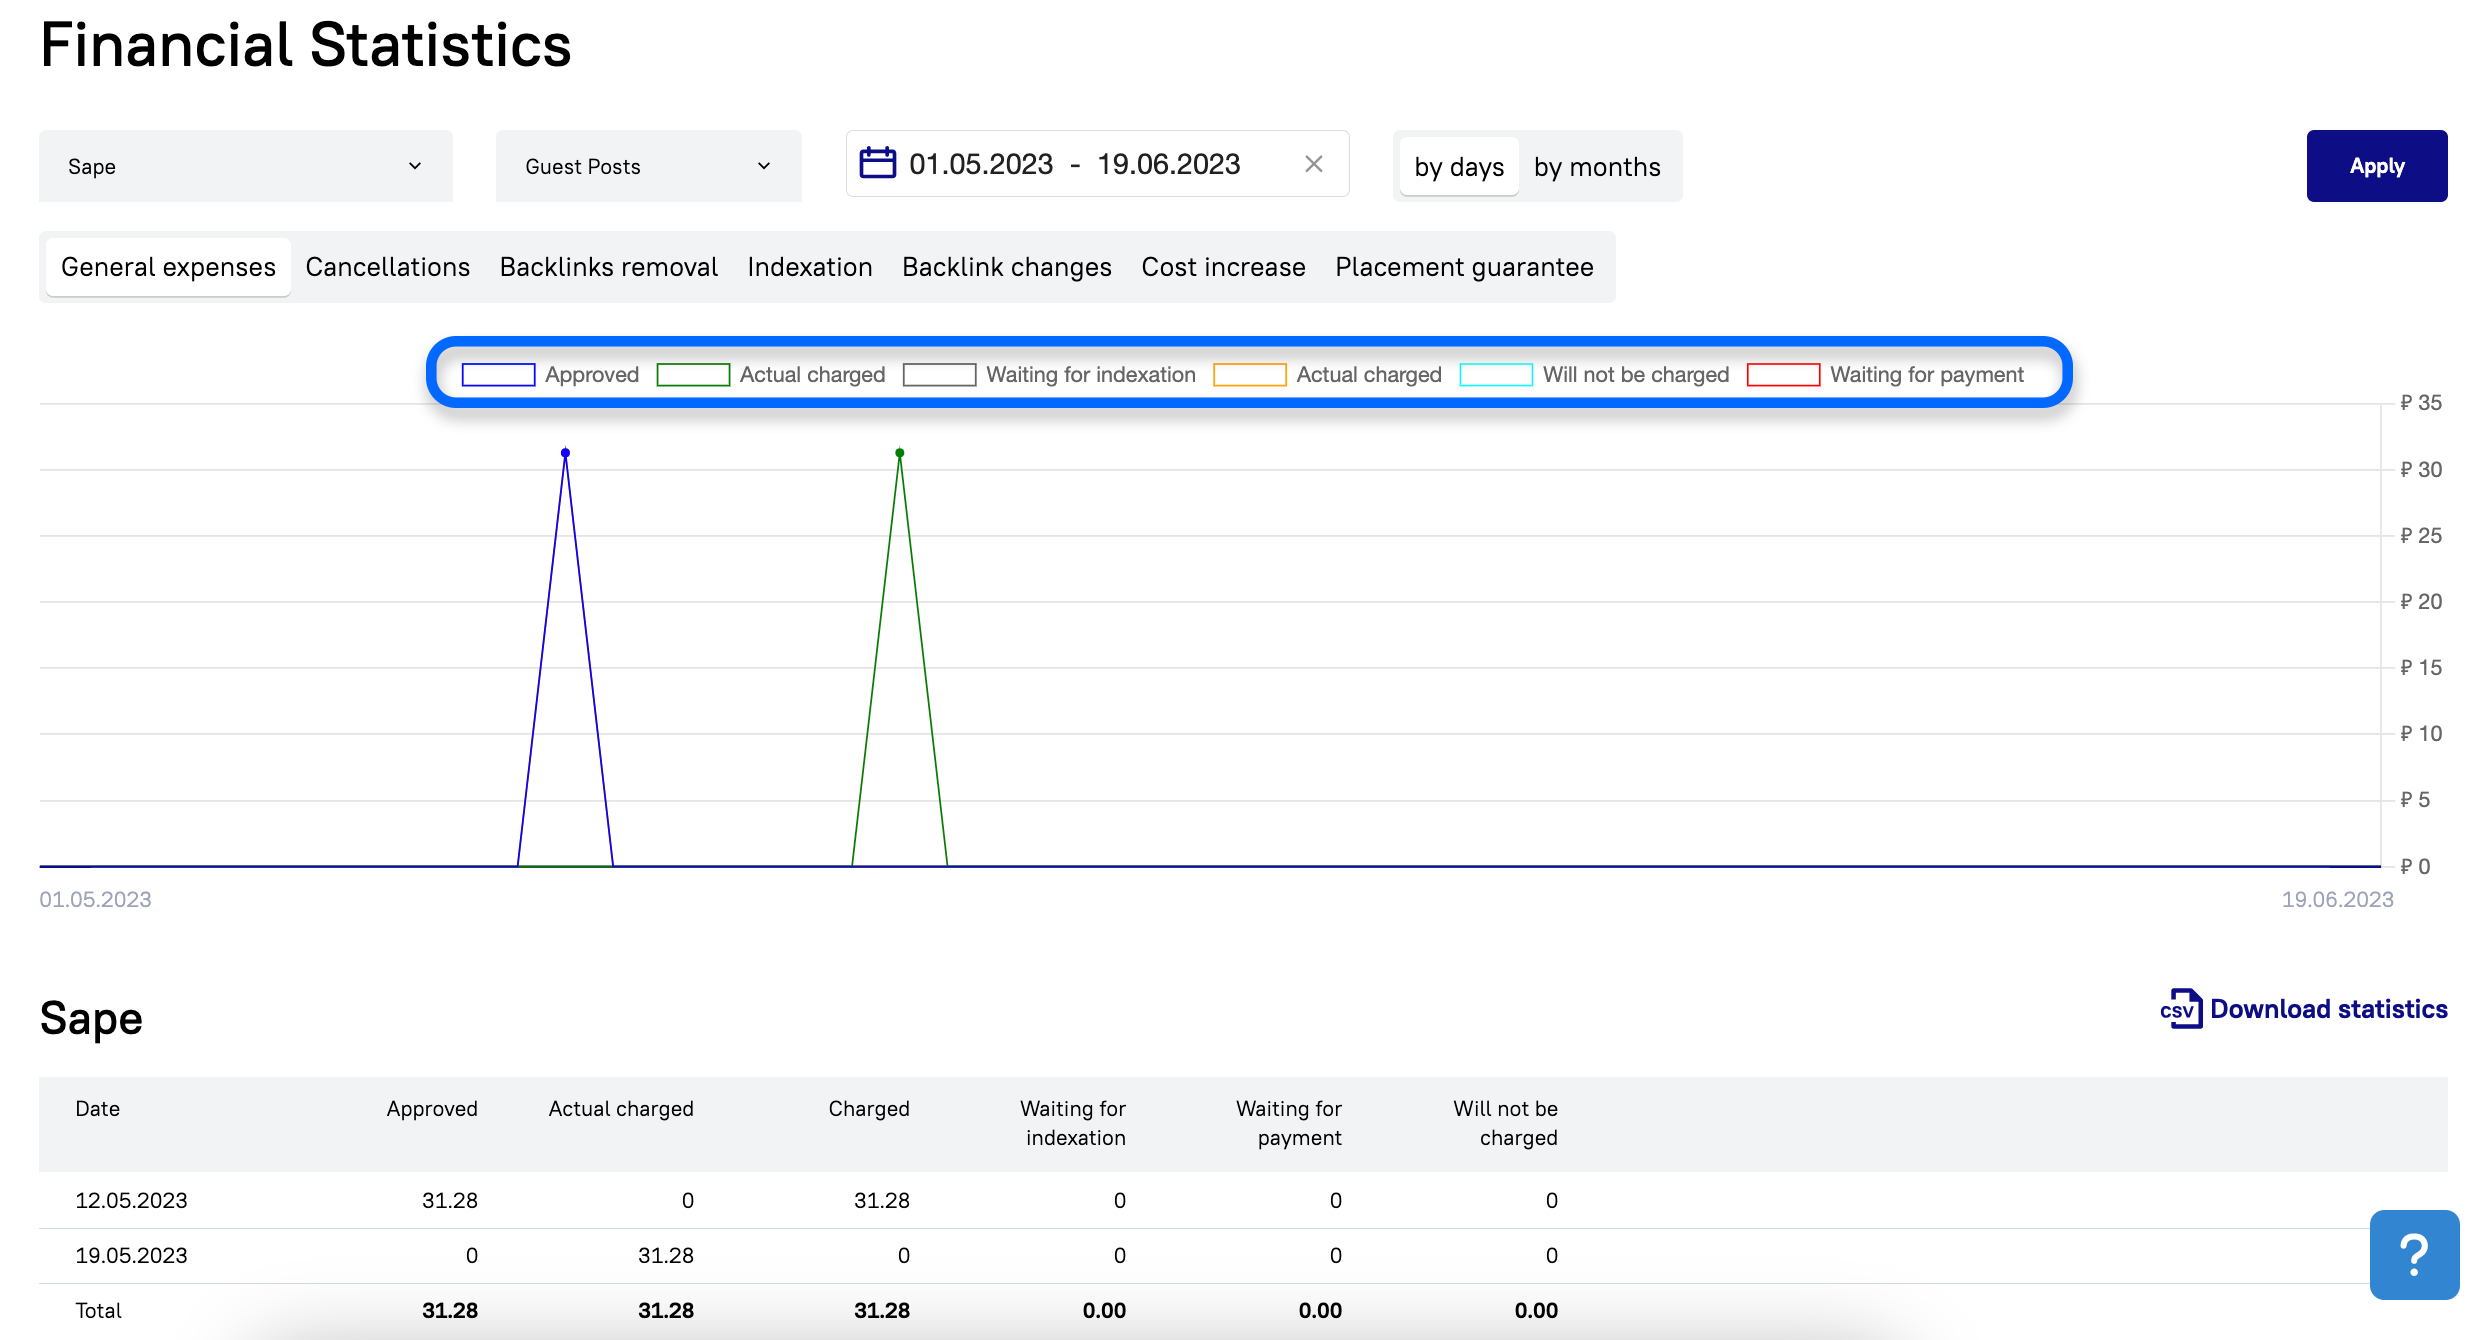
The financial statistics graphs visually represent all project expenses based on the link statuses. For Article links, the following data is displayed:

Approved - the cost of requests that were approved within the specified time interval. It includes the amounts for "Deducted for Approved," "Awaiting Indexing," "Awaiting Payment," and "Will Not Be Deducted."
Actually Deducted - the amount that was actually deducted/credited from your balance.
Awaiting Indexing - the cost of requests that were approved within the specified time interval and are still awaiting indexing.
Deducted - the sum of funds paid for requests that were approved within the specified time interval.
Will Not Be Deducted - the sum of funds that will no longer be deducted from your account for requests that were approved within the specified time interval (requests canceled after approval for various reasons).
Awaiting Payment - the sum of funds that have not yet been paid and potentially can be deducted for requests approved within the specified time interval.
Hovering over a point on the graph will display the date of the accrual/deduction and the corresponding amount.
For Guest posts you can select additional, more specific filter parameters:
Total expenses
Cancellations
Link removal
Link indexing
Link modification
Price increase
Placement guarantee
Below the graphs, the financial statistics are presented in tabular form, and there is an option to download a CSV document with the data export. By default, the table view displays 50 items on the page, and there is a "Show 50 more" button at the bottom.
